elec-rec Spectrum Resynth
Source
elec-rec spectrum resynth source: spectrum.py
Description
After writing a simple trigonometric/geometric (sine, square, sawtooth, triangle) waveform generator for my elec-rec electronic wind instrument, I turned my attention to supporting more complex sounds or possibly emulating the sound of real instruments. I spent some time searching online for a database of periodic waveform samples without any attack or decay covering a series of notes (I’ve been generating C3-C5 for the elec-rec) that I could process and upload to the elec-rec, but I didn’t find anything. The closest I did find was recordings of real instruments playing individual notes in their respective ranges, but these were unsuitable for my purposes due to the presence of attack, decay, and the non-periodic nature of the recording.
So I pursued the option of somehow processing the recordings of instruments playing isolated notes to something suitable for the elec-rec. I wrote spectrum.py, a Python[2] program that takes in the spectrum of such an isolated note recording, extracts the peaks of the spectrum that characterize the instrument, normalizes the extracted spectrum, and resynthesizes a single period of the waveform corresponding to that normalized characteristic spectrum across the note range of the elec-rec.
Usage: python spectrum.py <input spectrum> <output sample set file>The input spectrum file argument is the exported spectrum text file from a DFT on the waveform computed in Audacity. This can be obtained by selecting the constant tone region (not the attack or decay) of the instrument recording in Audacity, running “Analyze” -> “Plot Spectrum…”, and then exporting the spectrum to a file with “Export…”. The format of this file is a convenient white space separated list of frequency and magnitude, e.g.:
Frequency (Hz)	Level (dB)
1.345825	-93.693237
2.691650	-106.397537
4.037476	-89.047485
5.383301	-83.535919
6.729126	-83.263283
8.074951	-87.346184
9.420776	-78.454941
10.766602	-103.460739
...
Example Run
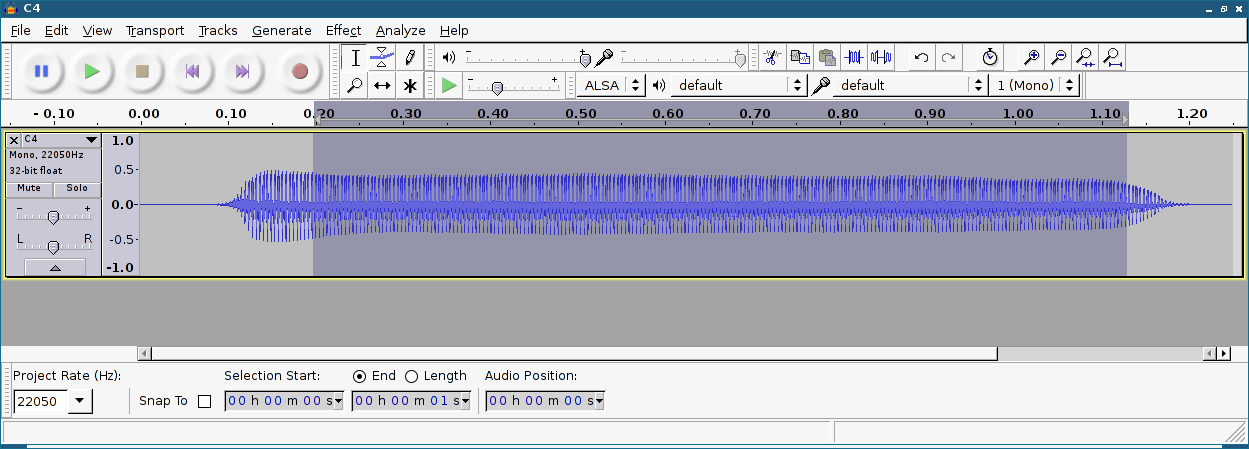
As an example, shown below is a run of spectrum.py on a recording of a saxophone playing C4 from here: http://www.phys.unsw.edu.au/music/saxophone/soprano/C4.html (wav sound clip at the bottom).
The first step is to fire up Audacity and extract the spectrum characteristic of the constant tone region in this recording:
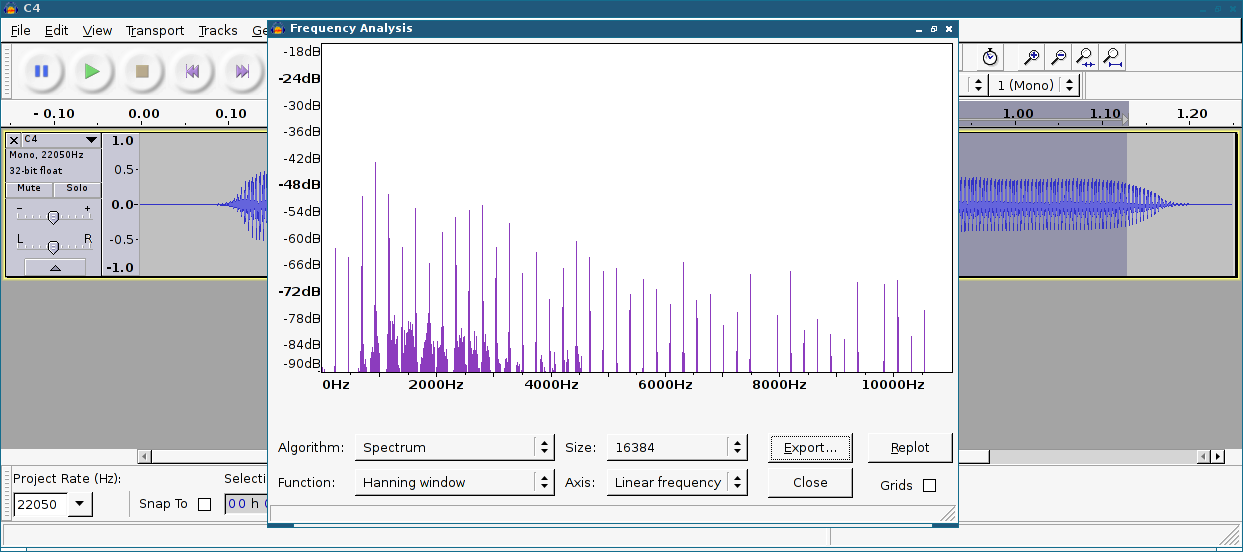
After exporting to spectrum-sax.txt, I run spectrum.py:
% python2 spectrum.py spectrums/spectrum-sax.txt sampleset-sax.txt
Peak Magnitude: -16.752928 dB @ 938.040161 Hz
Frequency (Hz) | Magnitude (dB) | Frequency (Hz) | Amplitude
468.347168 | 13.705787 | 1.000000 | 0.120301
702.520752 | 30.578157 | 1.500000 | 0.839246
938.040161 | 32.100370 | 2.002874 | 1.000000
1172.213745 | 30.660320 | 2.502874 | 0.847223
1406.387329 | 12.040176 | 3.002874 | 0.099309
1640.560913 | 18.868250 | 3.502874 | 0.217969
1874.734497 | 3.080345 | 4.002874 | 0.035400
2108.908081 | 9.474068 | 4.502874 | 0.073907
2343.081665 | 17.882810 | 5.002874 | 0.194591
2577.255249 | 13.088890 | 5.502874 | 0.112054
2812.774658 | 13.224266 | 6.005747 | 0.113814
3046.948242 | 10.410007 | 6.505747 | 0.082316
3281.121826 | 8.475780 | 7.005747 | 0.065883
3749.468994 | 0.000000 | 8.005747 | 0.024830
4217.816162 | 0.981720 | 9.005747 | 0.027801
4451.989746 | 0.963283 | 9.505747 | 0.027743
4686.163330 | 0.384510 | 10.005747 | 0.025954
A440 Sample Length: 109
Wrote 2000 periods of A4 synthesized waveform to synth.wav for testing.
Wrote elec-rec sample set to sampleset-sax.txt.
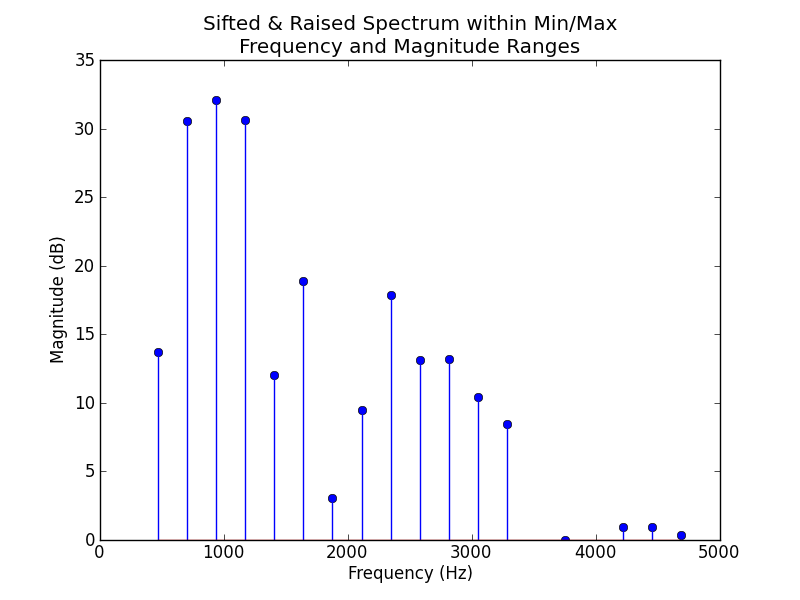
%The table produced by sample.py is the sifted (the spectrum within specified minimum and maximum amplitude and frequency boundaries) and raised (all magnitudes shifted to a 0 dB floor) extracted spectrum from the original spectrum-sax.txt.
Along the way, spectrum.py produces the following plots:
 |
 |
 |
 |
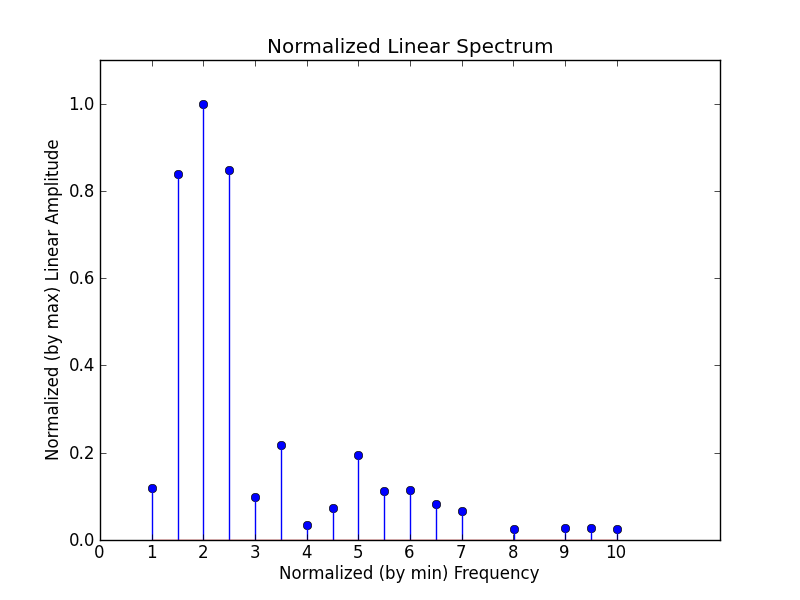
The first stem plot is the sifted and raised spectrum, and the second stem plot is the normalized sifted spectrum. spectrum.py assumes that the lowest frequency component of the sifted spectrum is the fundamental and defines it as frequency 1.0 in the normalized version. The amplitudes in the normalized spectrum are linear, and scaled relative to the maximum amplitude in the spectrum (assigned 1.0).
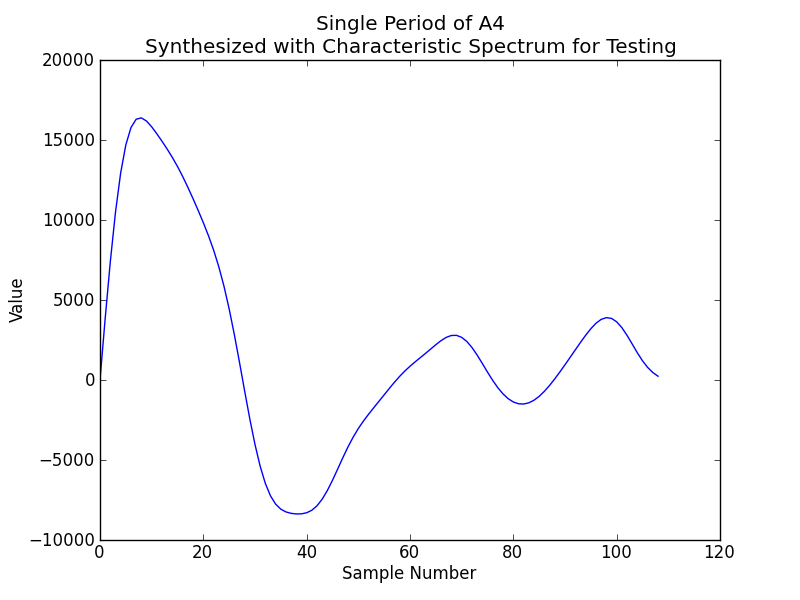
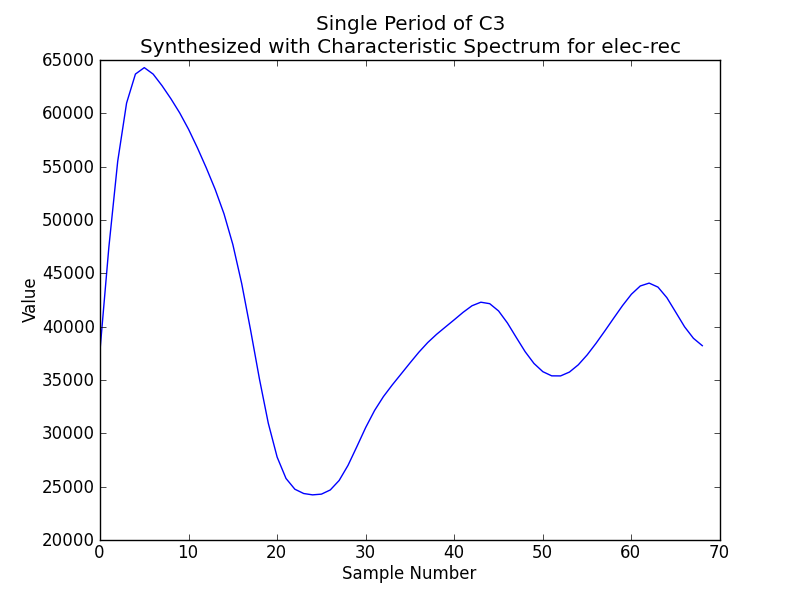
The first waveform plot is of a period of the synthesized A4 at 48KHz. This waveform is replicated 2000 times and written to a wavefile, synth.wav, for testing on a desktop computer. The second waveform plot is of a period of the synthesized C3 at 36KHz; these are the samples that would be apart of the sampleset uploaded to the elec-rec.
Download synth.wav here: link to synth.wav
Finally, spectrum.py writes sampleset-sax.txt, a CSV file containing the samples corresponding to all synthesized notes (C3 to C5) that can be uploaded to an instrument bank on the elec-rec with elec-rec-upload.py.
sampleset-sax.txt: https://github.com/vsergeev/elec-rec/blob/master/elec-rec-tools/sampleset-sax.txt
Limitations
spectrum.py has a number of limitations.
First, since spectrum.py only extracts the peak of the spectrum, it is discarding information that might be essential in reproducing the sound of the instrument. I suspect that the breathiness in a flute sound, for example, is high-frequency content that is likely discarded by spectrum.py (and probably not reproducible with the limited sampling rate on the elec-rec).
Second, when spectrum.py resynthesizes a single period waveform corresponding to the characteristic spectrum for each elec-rec note, the single period / duration it chooses is the period of the fundamental frequency component. For example, to resynthesize an A4 with the target characteristic spectrum, spectrum.py will synthesize 36KHz (sample rate of elec-rec) / 440Hz (A4 fundamental frequency) = 82 samples. However, this period is not the least common multiple of all frequency components in the characteristic spectrum, which can have floating point frequency values (not necessarily only integer harmonics of the fundamental) and therefore a prohibitively long least common multiple period. This means that the synthesized waveform is not truly periodic in terms of all present frequency content, so additional information is lost in the resynthesis process. This only emphasizes the point that the synthesized waveforms are approximations, not faithful reproductions of the original instrument.
Third, the attack and the decay of the instrument sound are not reproduced, only an approximation of the constant tone is synthesized. In some cases, people might better recognize an instrument by its attack (the quacky beginning of a saxophone), rather than its constant tone timbre.
